FPGraphTracer
FPGraphTracer is a simple, easy to use, tool for automatically tracing lines in a graph to extract the data it represents. Originally intended for the DIY speaker community, it outputs in the FRD/ZMA text based format used by many speaker designing programs, which can also be pasted directly into most Spreadsheet software.
Download now:
For Windows: download
For Mac: download
Basic use is simple:
Step 1: Open an image from the File menu or use the keyboard shortcut Ctrl-O
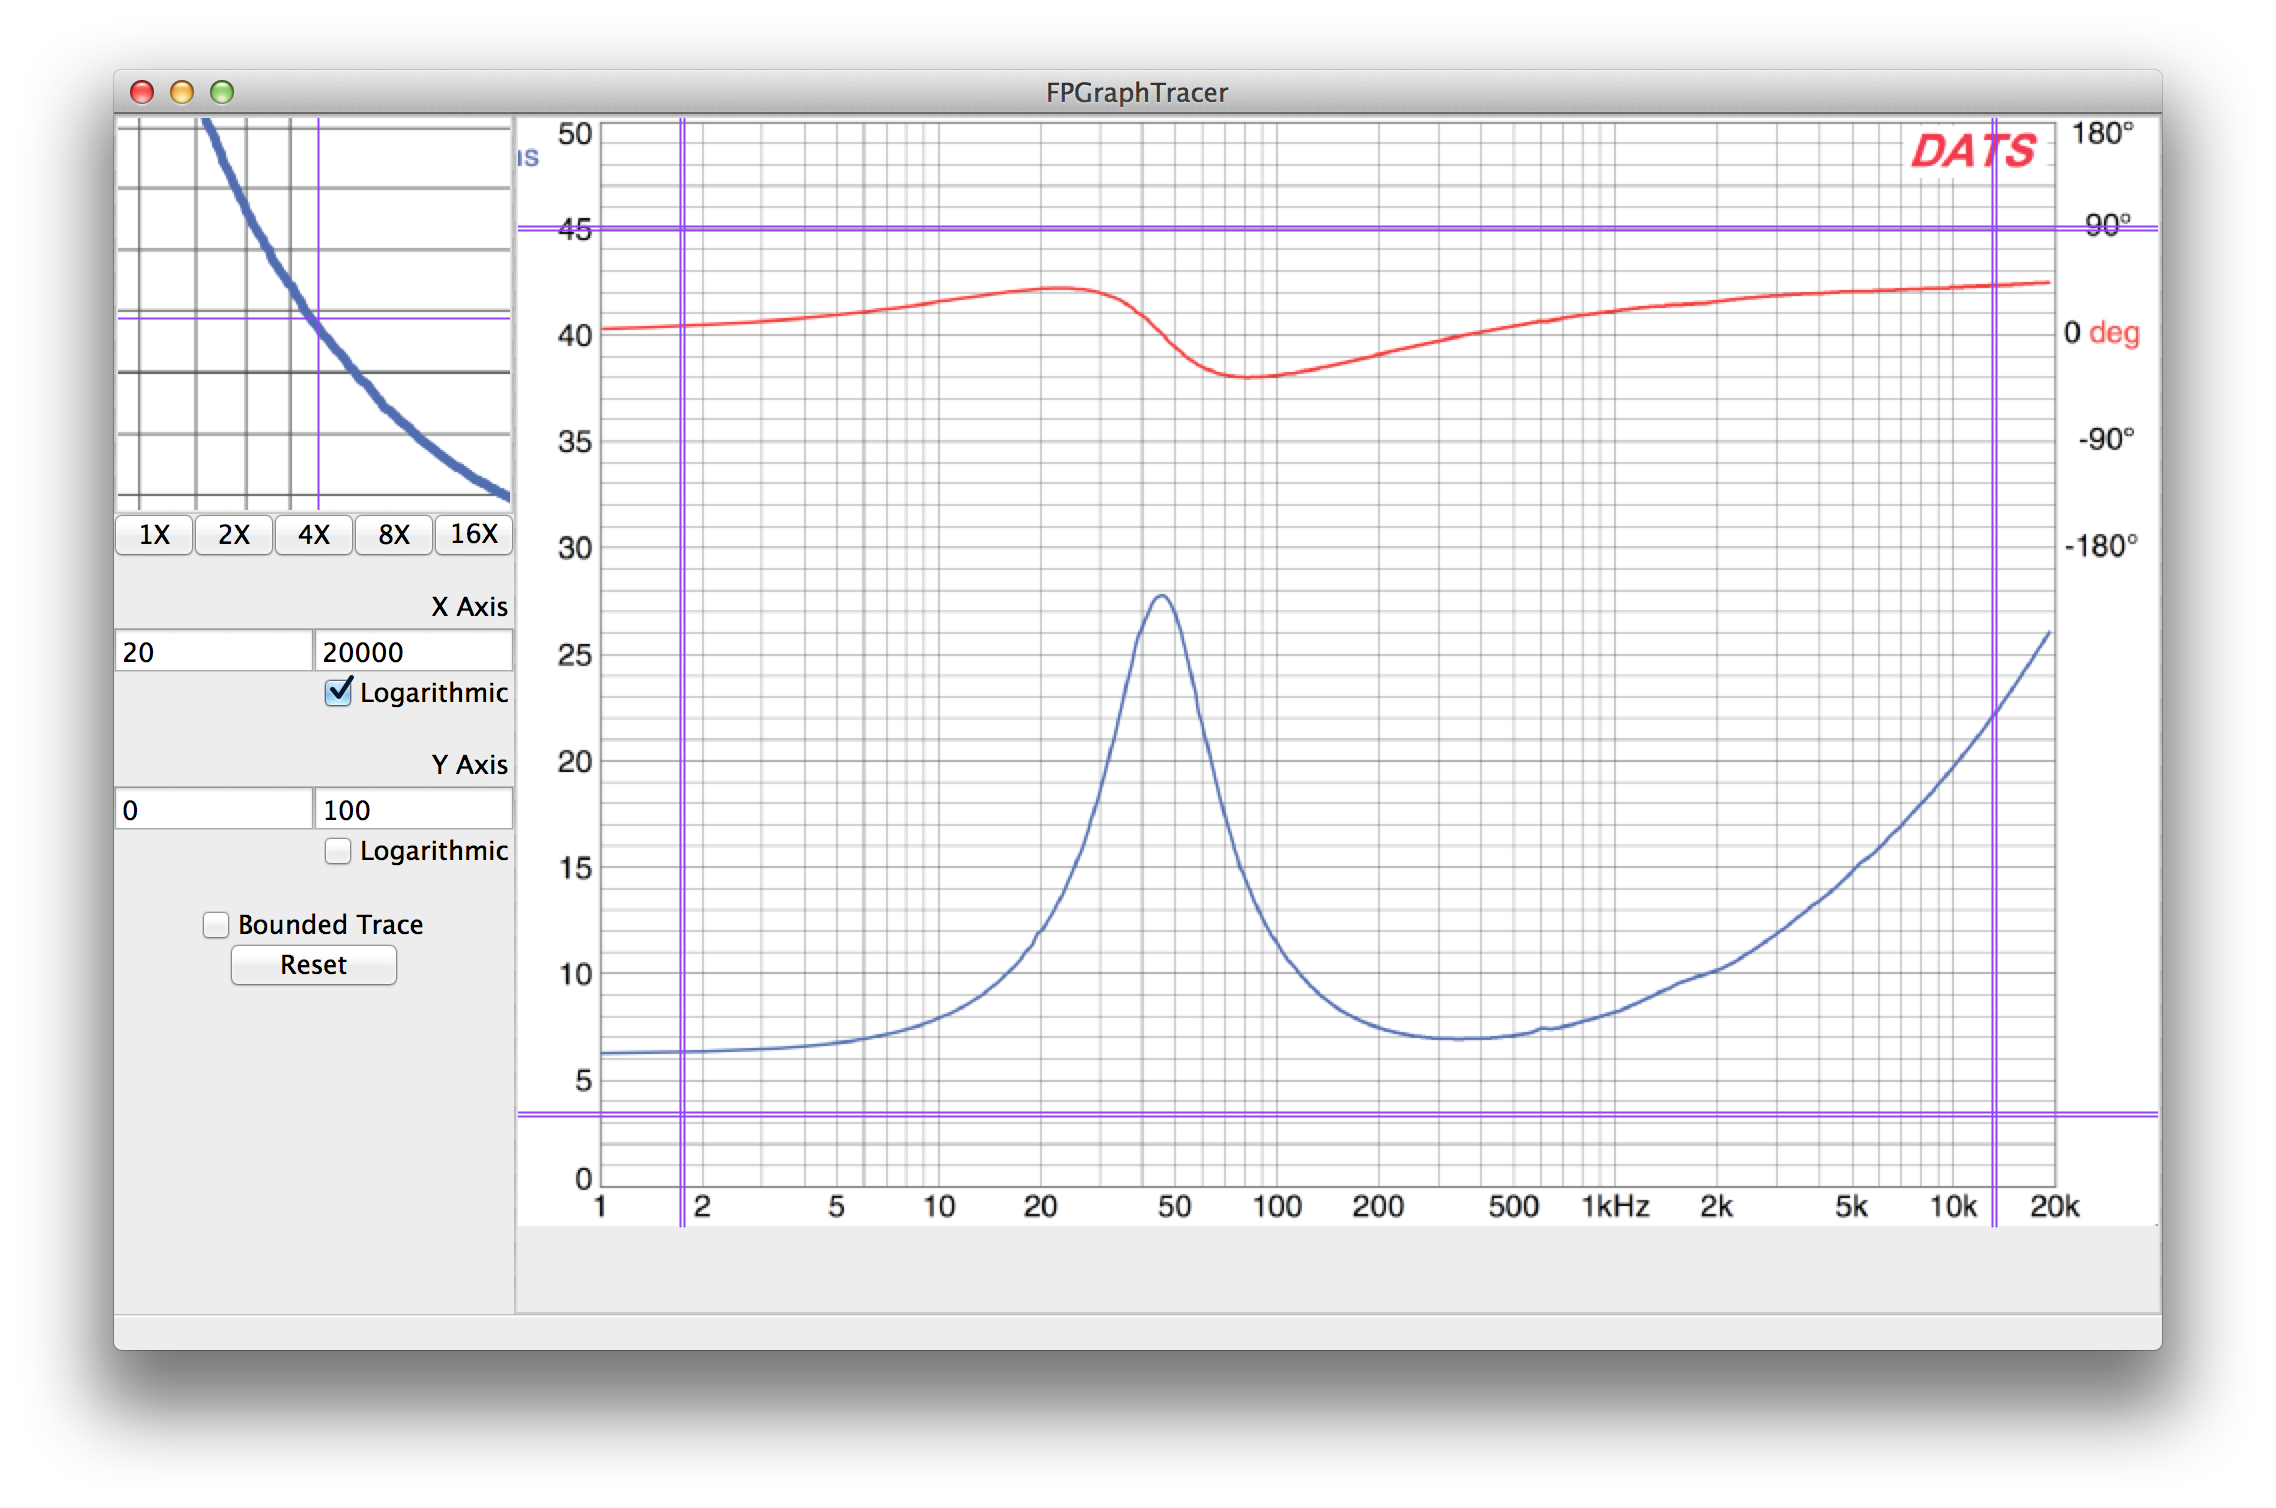
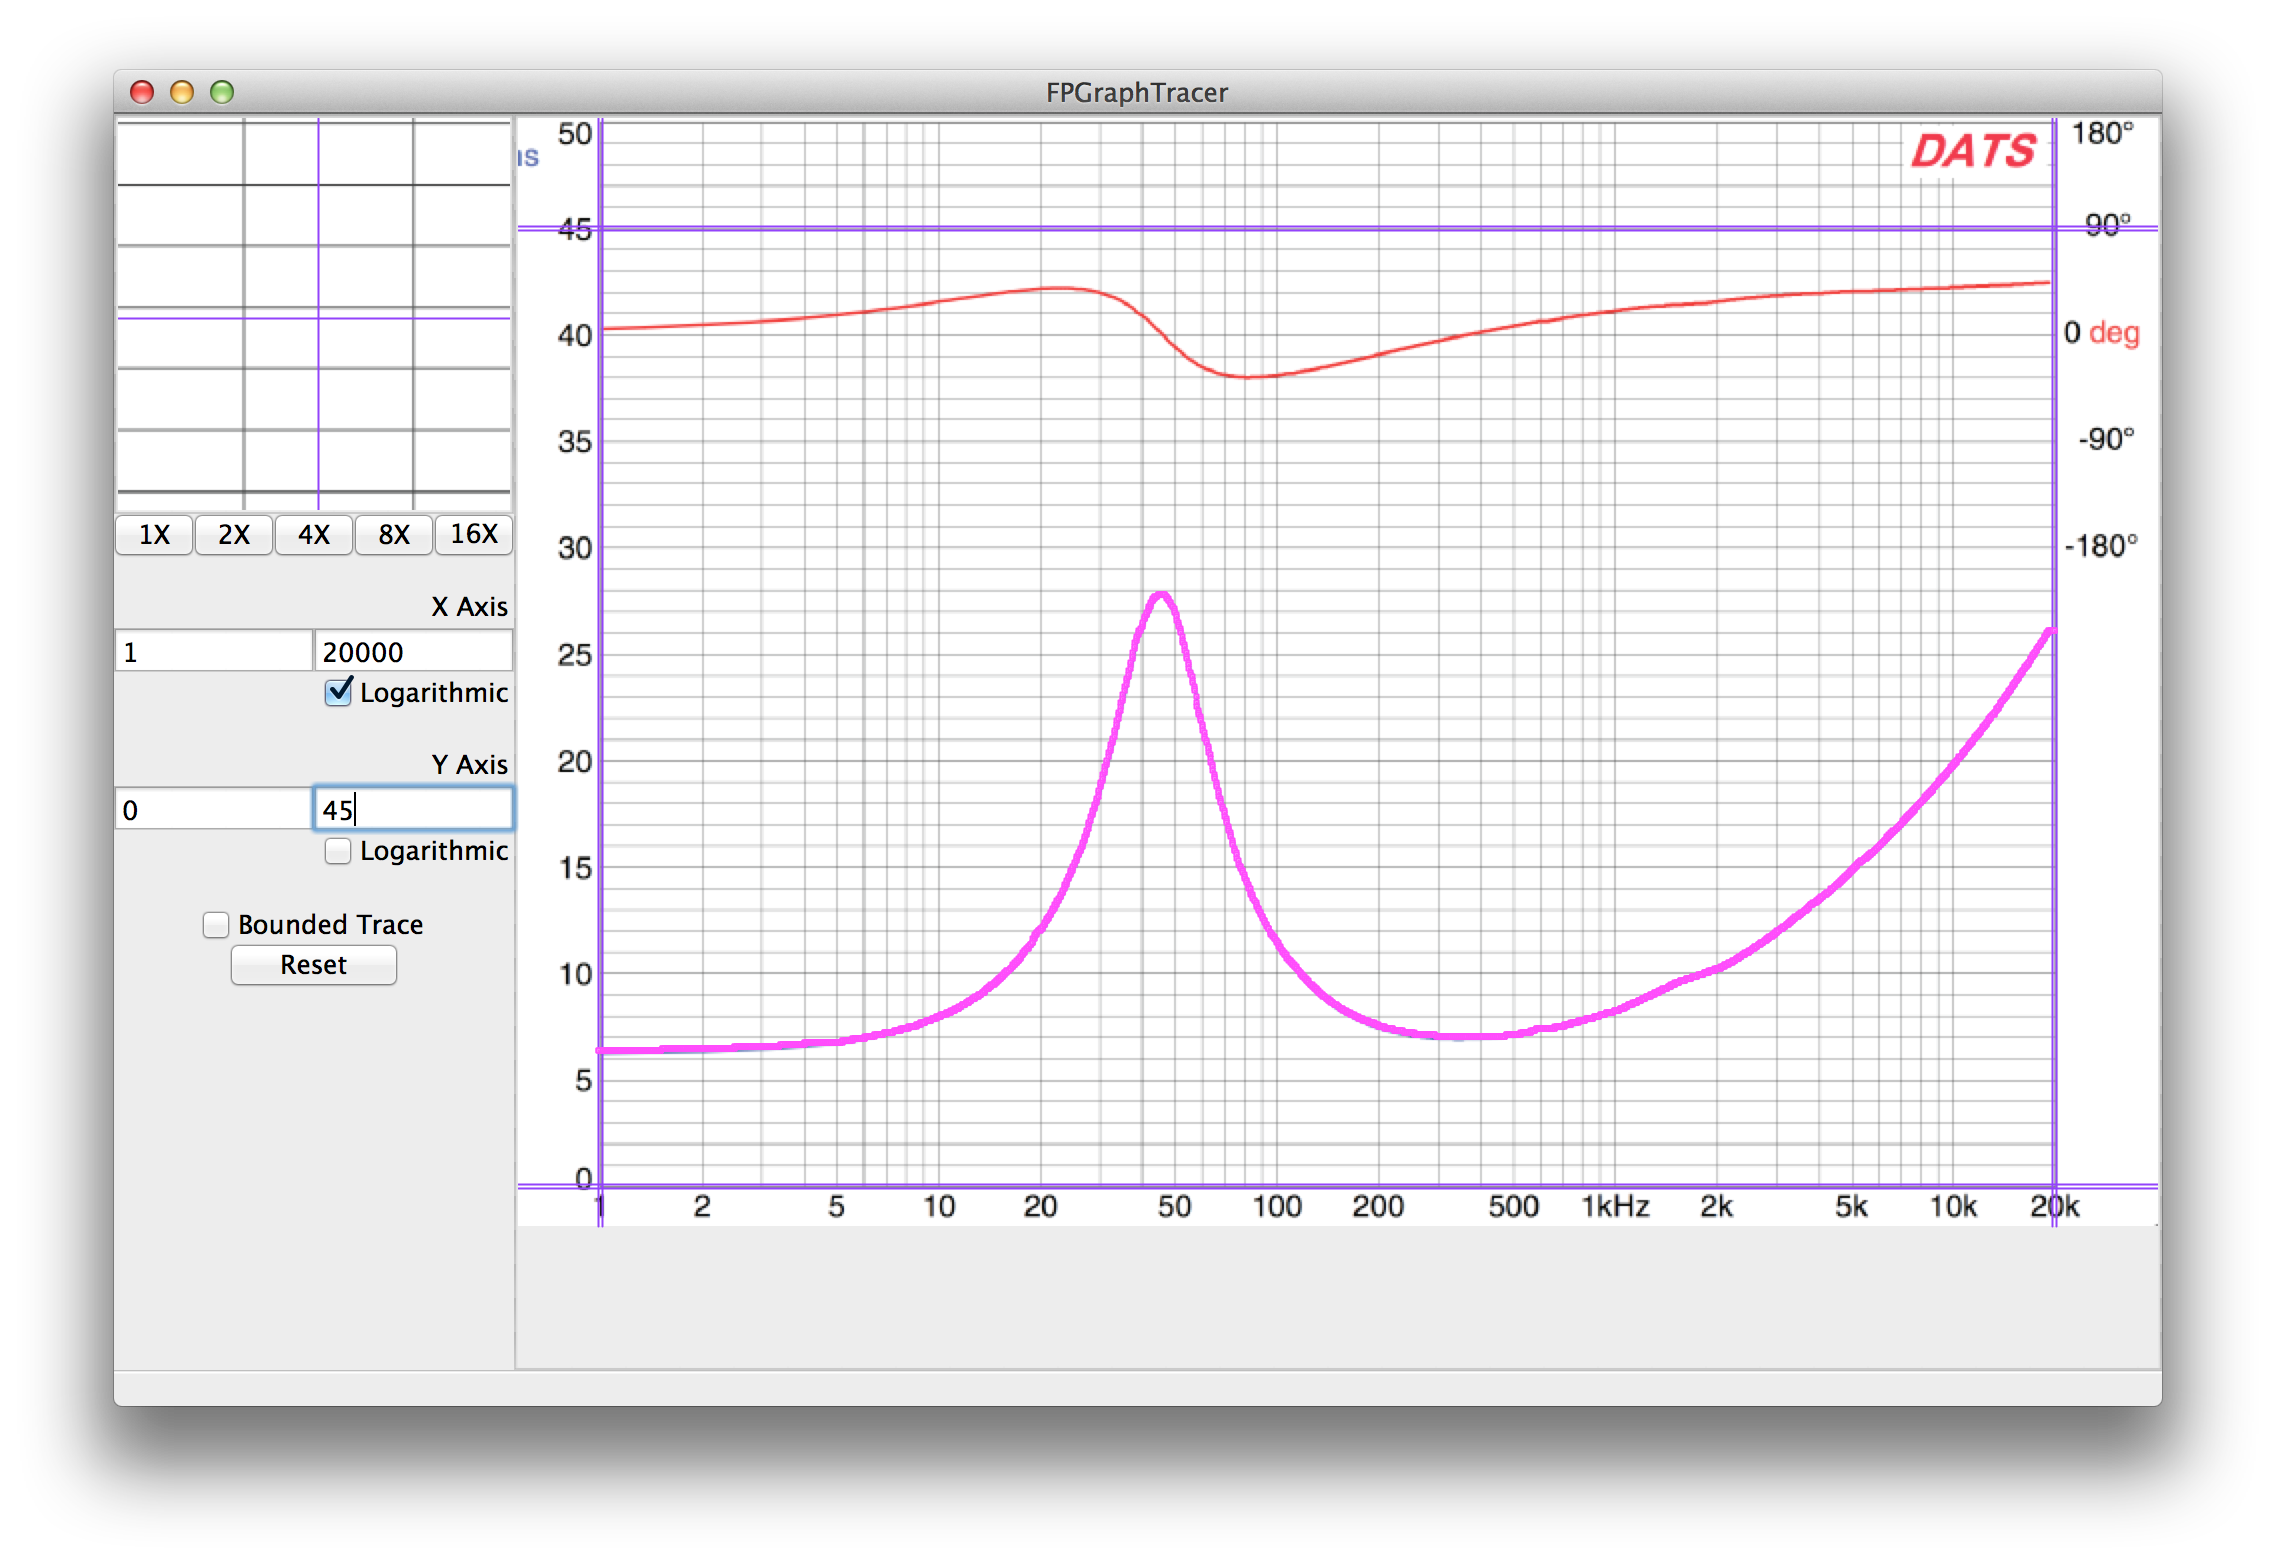
Step 2: Click on a point anywhere along the line you want traced. The line will turn Magenta showing you where it has been sampled.
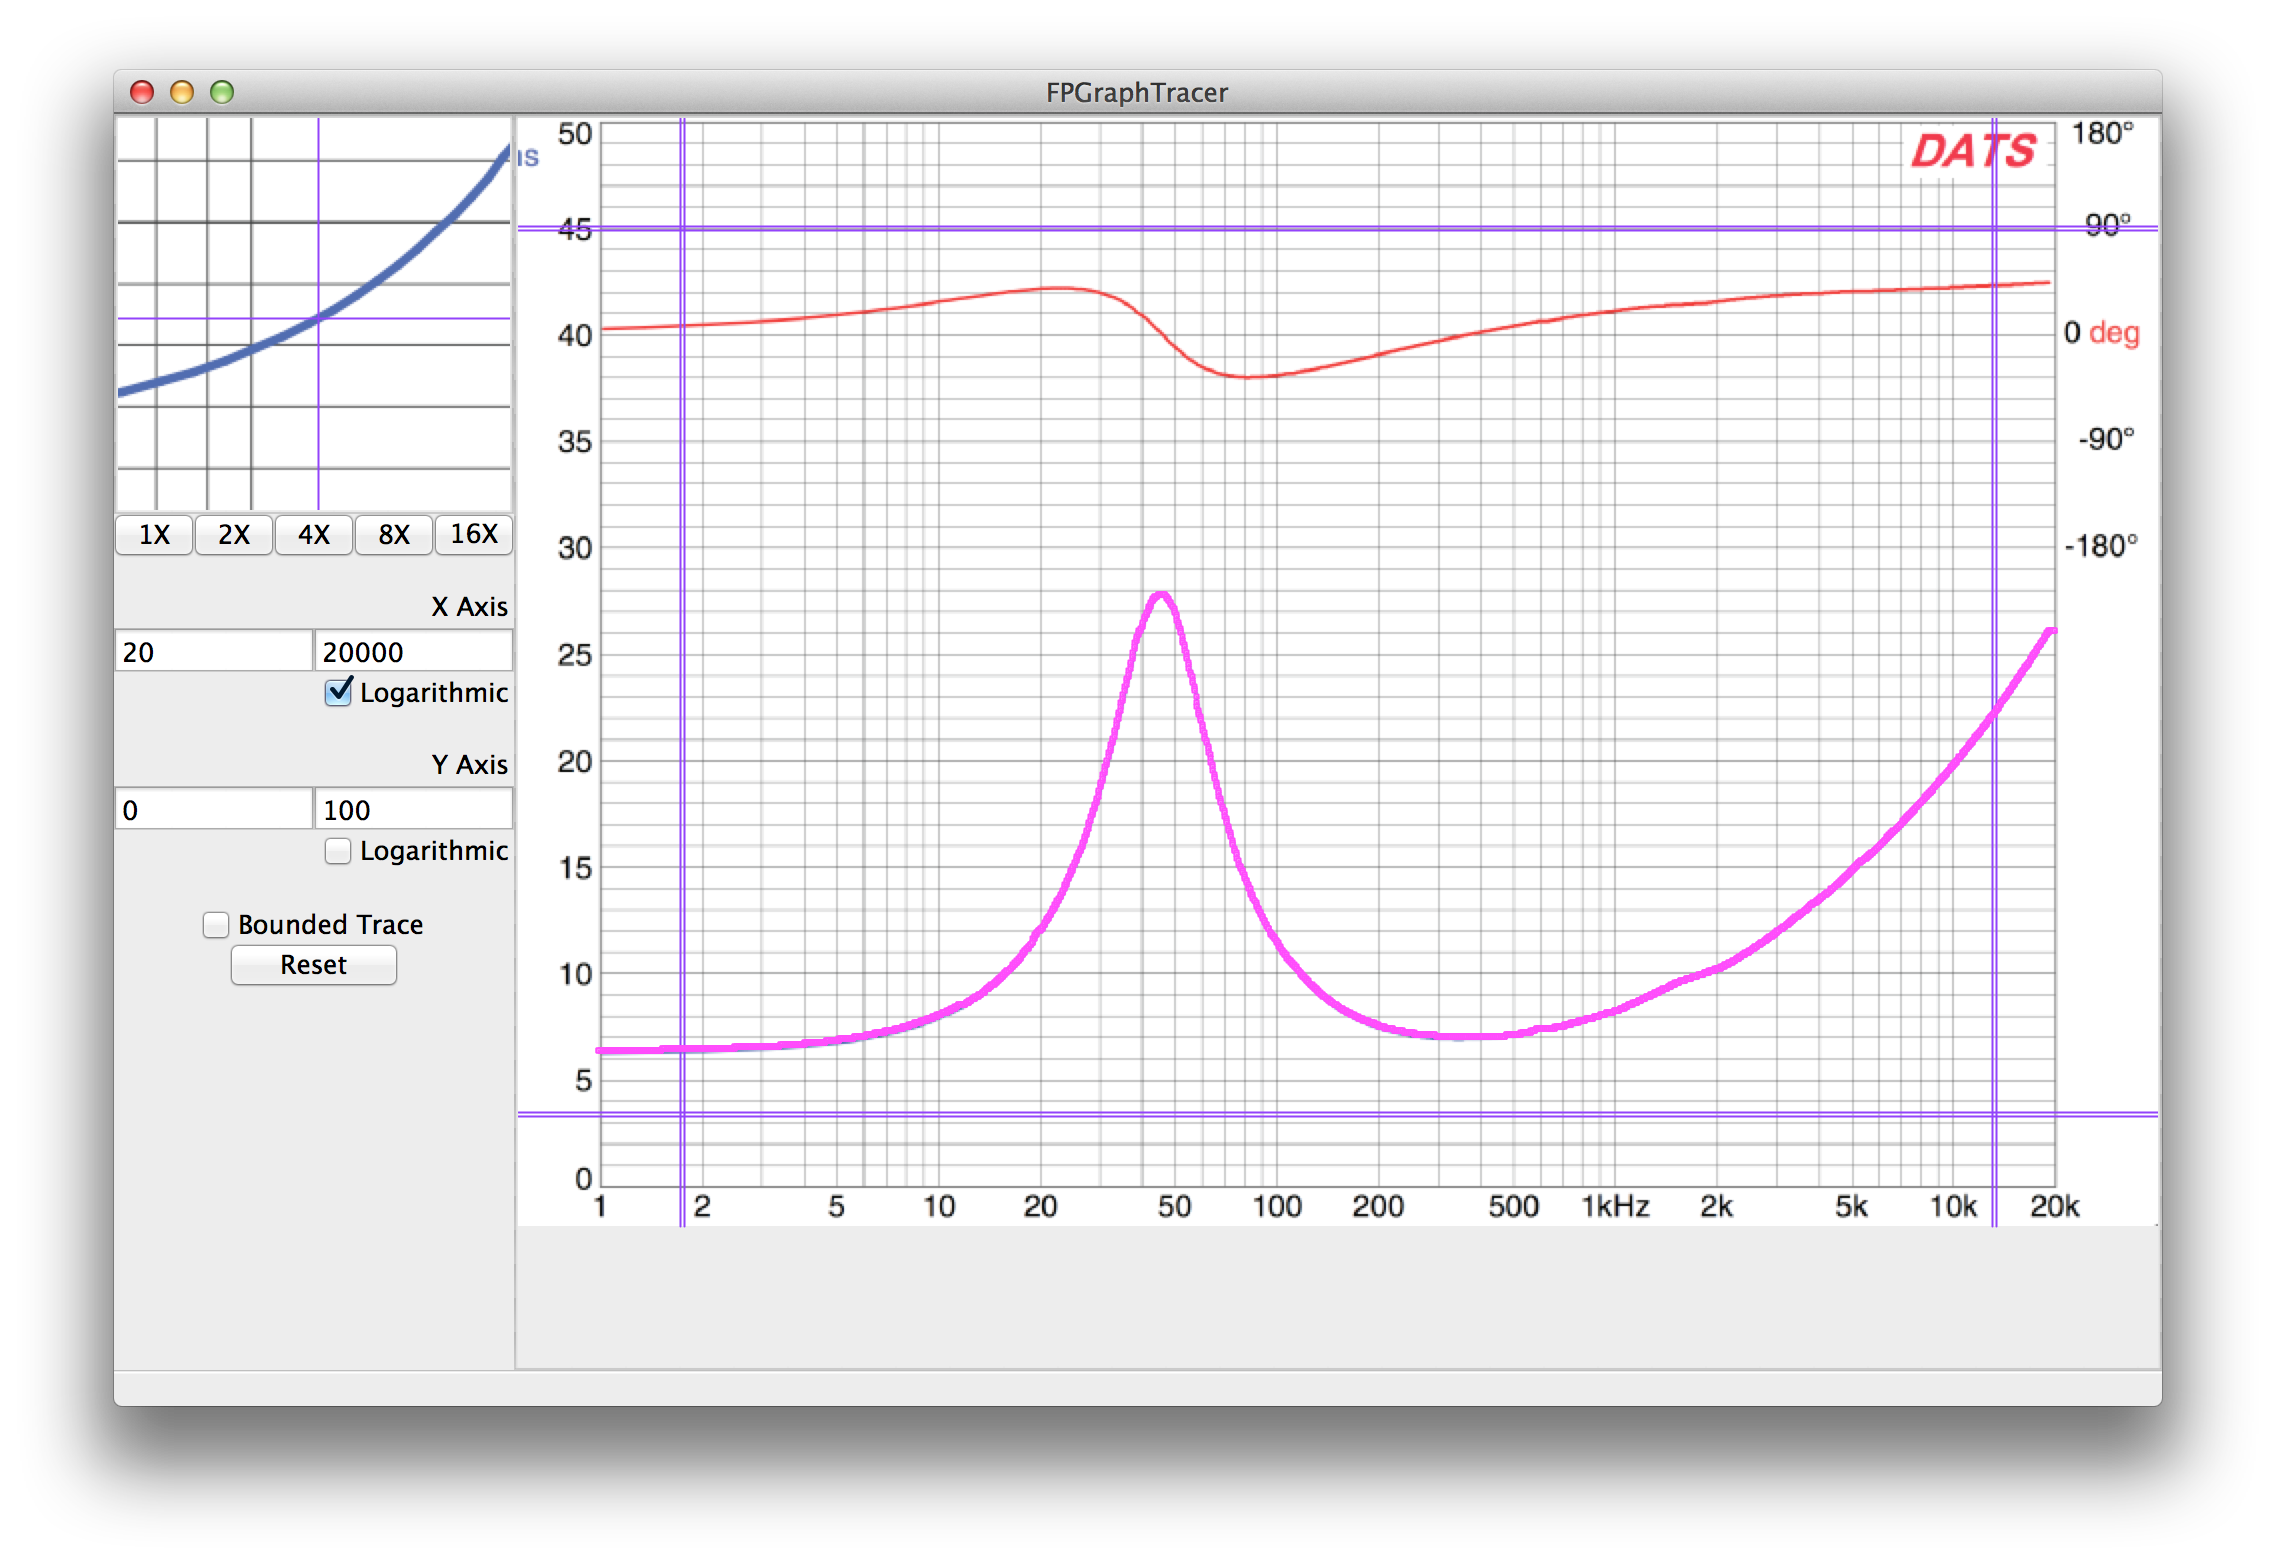
Step 3: The 4 purple bars will need to be adjusted so that accurate data can be extracted from the sampled points. Place them over known axis values. To achieve the highest level of accuracy, they should be placed far apart and the zoom window used to place them precisely.
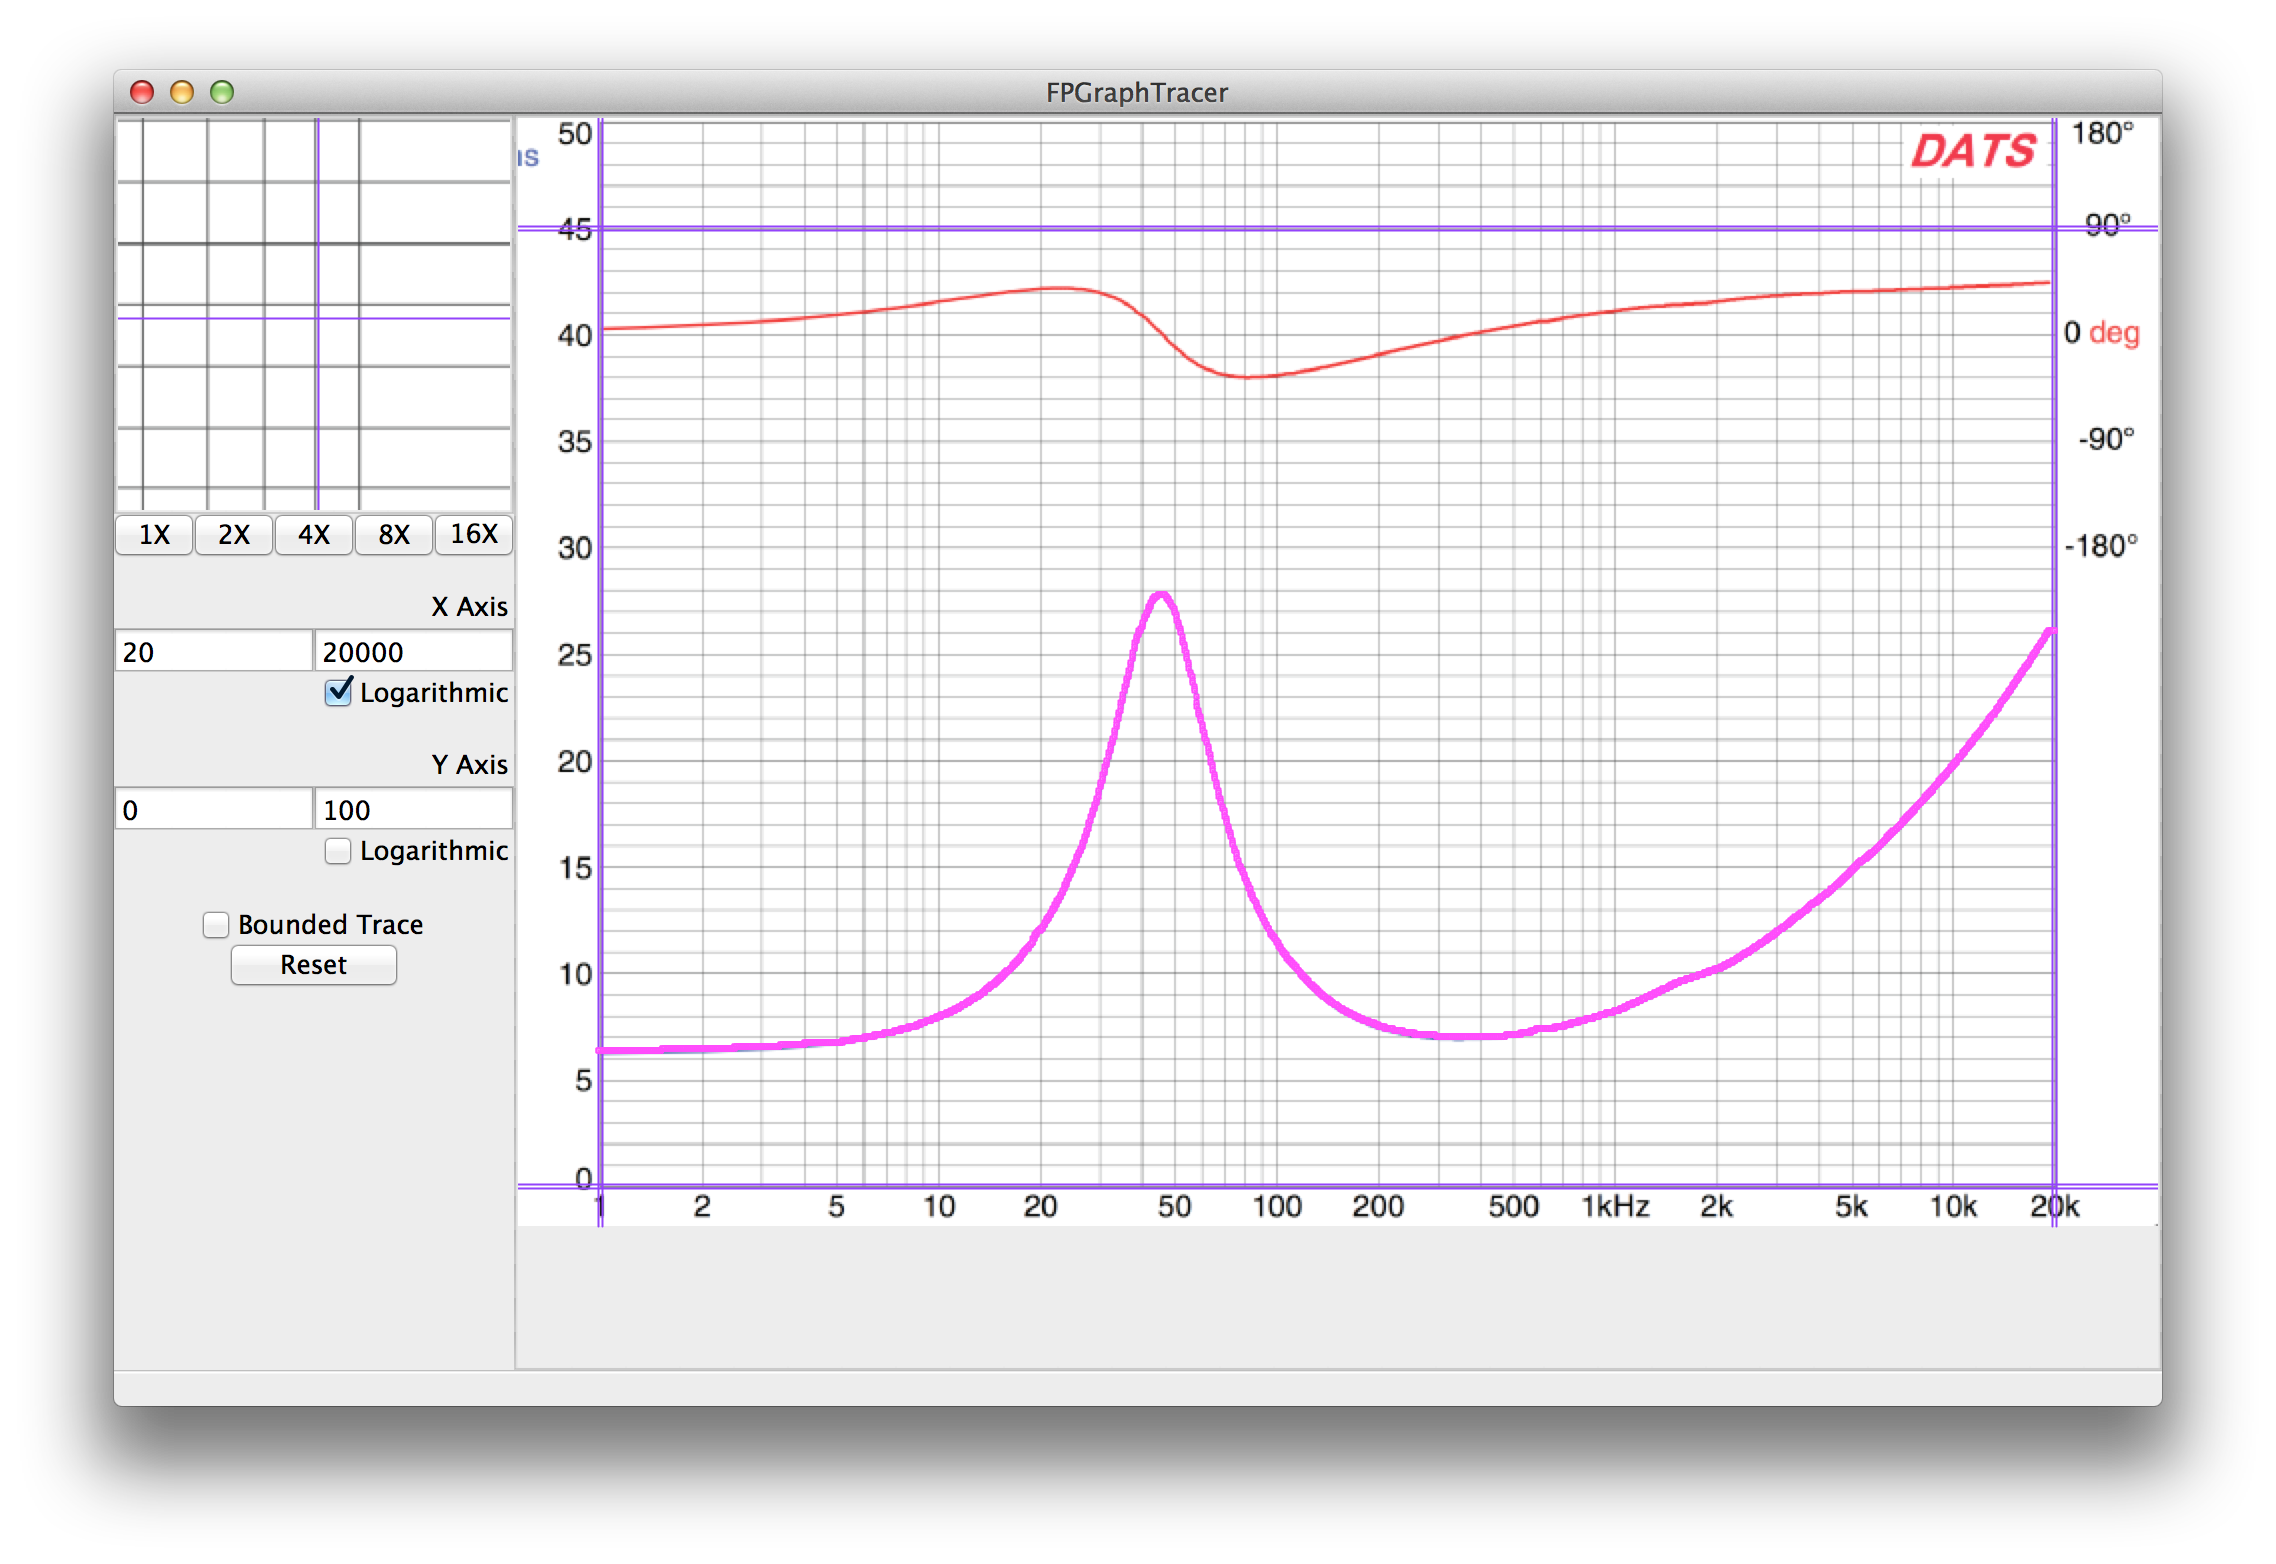
Step 4: Edit the Axis values on the left and set them to the values where the purple bars are placed.
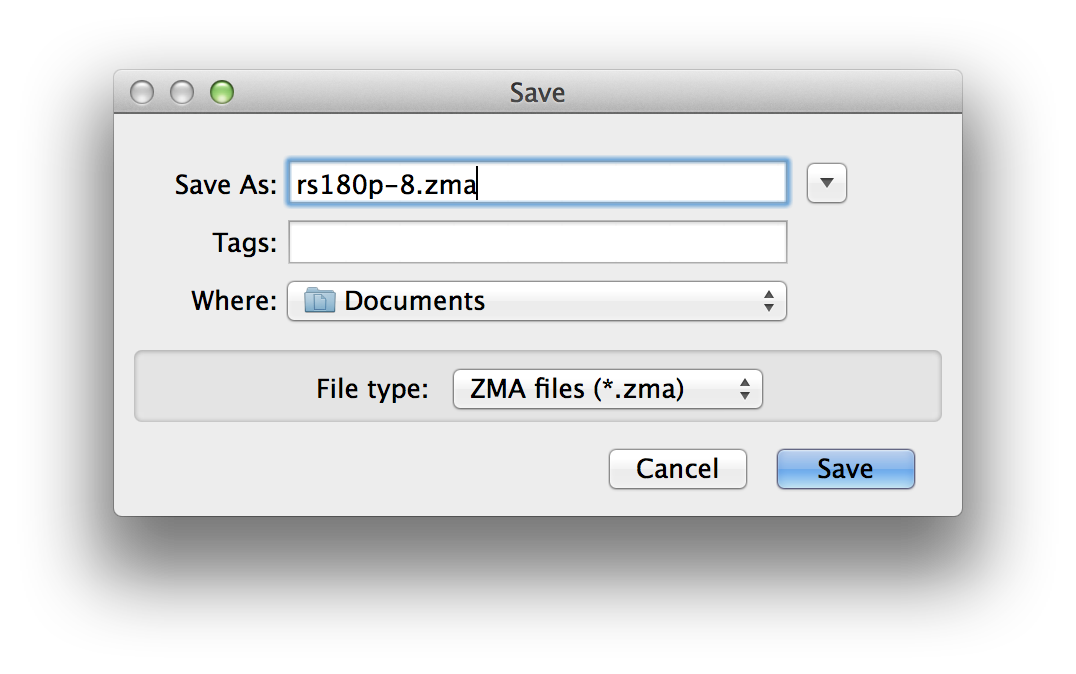
Step 5: Save the data from the File menu or use the keyboard shortcut Ctrl-S